
Quick Start
Start Web on a dashboard server, add one uptime monitor, and see its first check result. The basic setup is done when the monitor shows 정상 (Healthy) in step 2. After that you can connect the capabilities you need directly and, on a Linux Docker server, connect a Docker environment. Both are optional.
Before you start
- Dashboard server: Docker and Docker Compose
- Network: the dashboard server must reach the URL or TCP port you want to check.
1. Start Web (dashboard server)
On the dashboard server, download the Compose file:
mkdir everyup && cd everyup
curl -O \
https://raw.githubusercontent.com/ai-turn/everyup/main/web/docker-compose.yml
Set the public address (optional)
If users or monitored servers reach Web through another address (for example https://monitor.example.com), set it in .env in the same directory before starting:
echo 'EVERYUP_PUBLIC_URL=https://monitor.example.com' > .envEveryUp puts this address into Docker installation commands, direct OTLP setup, and infrastructure Collector configuration, so it must be an absolute HTTP(S) address reachable from the monitored server. localhost is not accepted. When omitted, the connection screens suggest the address the browser used and let you edit it.
Start
docker compose up -dWhat the downloaded Compose file contains
services:
  everyup:
    image: aiturn/everyup:latest
    container_name: everyup
    environment:
      EVERYUP_PUBLIC_URL: ${EVERYUP_PUBLIC_URL:-}
    ports:
      - "3001:3001"
    volumes:
      - everyup-data:/app/data
    restart: unless-stopped
    healthcheck:
      test: ["CMD", "wget", "--no-verbose", "--tries=1", "--spider", "http://localhost:3001/api/v1/health"]
      interval: 30s
      timeout: 10s
      retries: 3
      start_period: 10s

volumes:
  everyup-data:
    driver: local
Open http://<dashboard server IP>:3001 in a browser and create the first admin account. If it does not open, see The dashboard does not open.
2. Add an uptime monitor (browser)
On the 업타임 (Uptime) screen, click 추가 (Add). Leave 체크 방식 (Check type) at HTTP, enter a 이름 (Name) and the public URL to check (for example https://api.example.com/health), and click 추가 (Add). The other fields can keep their defaults.
Web runs the check, so nothing is installed on the target. The first check runs as soon as you add the monitor and repeats every 30 seconds. On a 2xx response the monitor shows 정상 (Healthy).
Internal addresses such as localhost and private networks can't be checked. See Uptime monitors for every field and TCP checks.
3. Connect capabilities directly (optional)
Apps send logs, API requests, and metrics to Web directly through OpenTelemetry, and server resources come from a standard OpenTelemetry Collector. No Docker is required, and you connect only the capabilities you need.
| Data | Dashboard path |
|---|---|
| Logs | 로그 (Logs) → 로그 연결 (Connect logs) → OpenTelemetry로 직접 연결 (Connect directly through OpenTelemetry) |
| API requests and traces | API 요청 (API requests) → API 연결 (Connect API) → OpenTelemetry로 직접 연결 |
| App metrics | 메트릭 (Metrics) → 메트릭 연결 (Connect metrics) → OpenTelemetry로 직접 연결 |
| Server resources | 인프라 (Infrastructure) → 인프라 연결 (Connect infrastructure) |
The connection screen shows the export address and API Key to apply in your app or Collector. See Connecting OpenTelemetry directly for language-specific setup and how to confirm receipt.
4. Connect a Docker environment (optional)
Installing the monitoring bundle (the Docker Collector plus the components it needs) on a Linux Docker server collects container state, logs, host resources, and API requests in one install, without changing your apps. This data appears in that Docker 환경 (Docker environment), not in capability menus such as Uptime, Logs, or Infrastructure. With a single server you can install it next to Web.
The monitored server needs:
- Linux, Docker Engine, Docker Compose 2.23.1 or newer,
curl, andsudo. Check the Compose version withdocker compose version. - Network access to port
3001on the dashboard server (or the address set inEVERYUP_PUBLIC_URL)
Create a Docker connection command (browser)
In the browser, open Docker 환경 (Docker environments) in the dashboard. Click Docker 연결 (Connect Docker) at the top right, then name the environment and choose its collection scope:
| Scope | Collection and reception | Installs |
|---|---|---|
| 전체 (All) | Container state, logs, infrastructure, API tracing, and OTLP metric reception | Docker Collector, eBPF Observer |
| 기본 (Basic) | Docker service state, logs | Docker Collector |
| 사용자 지정 (Custom) | Only what you select (and only the permissions it needs) | Docker Collector, plus the eBPF Observer if you select API tracing |
To see app metrics, enable reception and configure the app or an OpenTelemetry Collector to export them. Selecting logs or API tracing also enables the uptime capability required for Docker discovery.
The eBPF Observer records API latency and traces without changing your application. It runs with permissions separate from the Docker Collector and discovers container processes automatically, so there is no port list to maintain.
Custom profiles without uptime collection
If a custom profile omits Docker uptime collection (for example, a metrics-only profile), apps sending telemetry to the Collector's OTLP gateway (:4318) need a service-scoped bearer token. Generate a token for each app and set its Authorization header. See the Collector networking notes for the command and exporter settings.
The connection flow then shows an installation command shaped like this:
curl -fsSL 'https://<Web address>/api/v1/agents/install.sh' |
  sudo sh -s -- 'https://<Web address>' '<join code>'
The join code works once, for ten minutes
If it expires or has already been used, click 새 코드 (New code) in the installation screen and copy the refreshed command. The long-lived API key is never displayed in the browser; it is delivered directly to the target server during installation.
Install the monitoring bundle (monitored server)
Copy the displayed command and run it on the monitored Linux Docker server.
The installer checks Docker and Compose, writes the bundle under /opt/everyup-agent, backs up any previous configuration as compose.yaml.bak.<timestamp>, and starts only the components required by the selected scope. Your application Compose file, images, ports, and containers are left unchanged. The everyup-agent in the path and container name is the Docker Collector's internal name.
When it finishes, the last lines read:
EveryUp Docker collector installation complete.
Configuration: /opt/everyup-agent/compose.yaml
Check status: docker compose --env-file /opt/everyup-agent/.env -f /opt/everyup-agent/compose.yaml ps
If it stops earlier, look up the last error line in Troubleshooting.
To set it up by hand instead, see agent/docker-compose.yml and the Docker Collector configuration.
Check the connection (browser)
After installation, open Docker 환경 in the browser. Within about 30 seconds, the environment changes from 설치 대기 (awaiting install) to 수집 중 (collecting). When uptime collection is enabled, the containers on that server also appear as services.
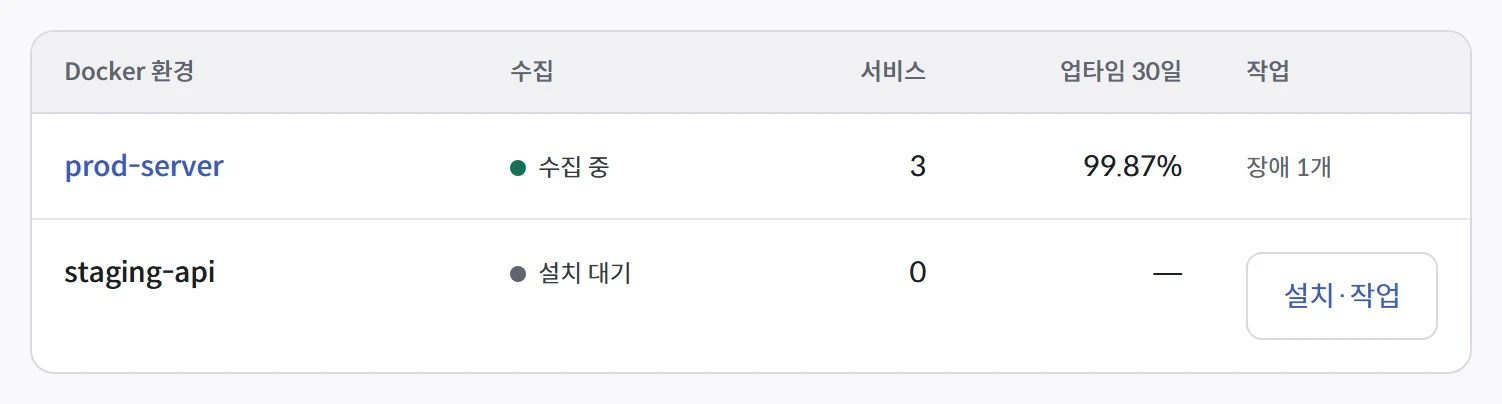
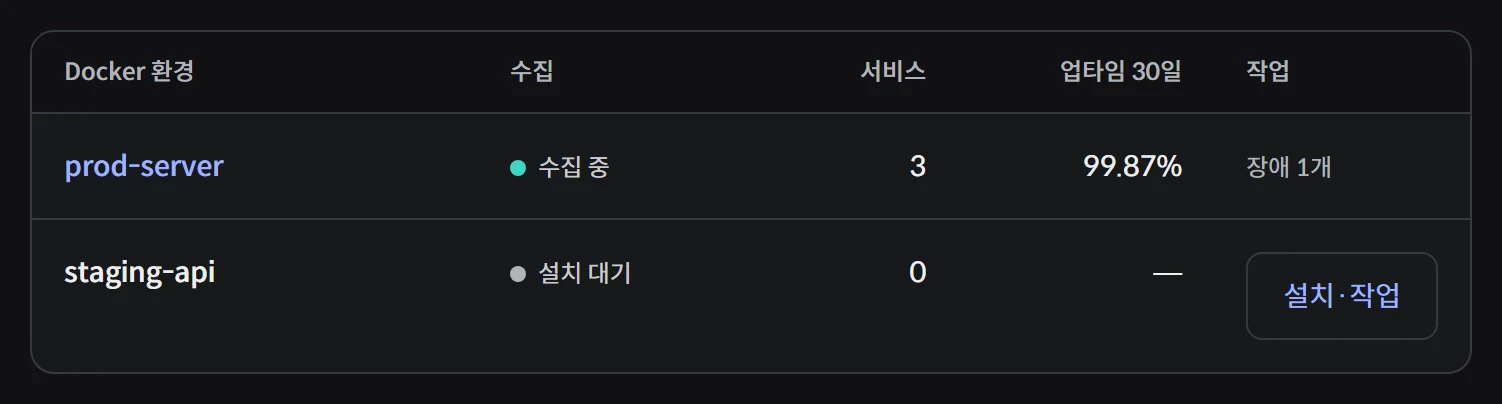
수집 중 means connected; 설치 대기 means the Collector has not connected yet. The dashboard UI is Korean only.
If the environment stays at 설치 대기, see Troubleshooting.
수집 중 describes Collector contact. Open the environment's 모니터링 설정 가이드 (monitoring setup guide) and check configuration application and 데이터 수신 확인 (data receipt) too. Generate app requests to produce logs and traces. For app metrics, apply export settings and wait for a collection interval before checking receipt.
Next steps
Once your monitoring targets are connected, set up Notifications. Connect a Telegram, Discord, or Slack channel and enable alert rules to receive notifications when their conditions are met.
Other guides:
- Uptime monitors: check URLs and TCP ports, pause monitors, read check history
- Monitoring setup: connect OpenTelemetry directly, diagnose collection, add capabilities to a Docker environment
- Header & body capture: see why a request failed
- Automatic eBPF Observer: API latency and traces in a Docker environment
- Upgrade and uninstall: apply new versions, undo an installation