
Introduction
EveryUp is a self-hosted tool for viewing service health, logs, API requests, and server resources in one place. Start with failing targets and delayed collection, then investigate recurring errors and request trends.
Run Web on a dashboard server, then connect monitoring targets directly for each capability you need. Check public URLs and TCP ports with uptime monitors, and connect apps directly through OpenTelemetry for logs, API requests, and metrics. Server resources come from a standard OpenTelemetry Collector. On a Linux Docker server you can also connect a Docker environment, an optional integration that collects container state, logs, and host resources in one install without changing your apps.
| Part | What it does | Where it runs |
|---|---|---|
| Web | Dashboard, uptime checks, OTLP reception, alert rules, notification channels, history | Your dashboard server |
| OpenTelemetry SDK | Sends app logs, traces, and metrics directly to Web | Each app |
| Standard OpenTelemetry Collector | Sends server CPU, memory, disk, and network to Web | Each server you monitor |
| Docker Collector (optional) | Docker discovery, container state, logs, host metrics | Each Docker host you monitor |
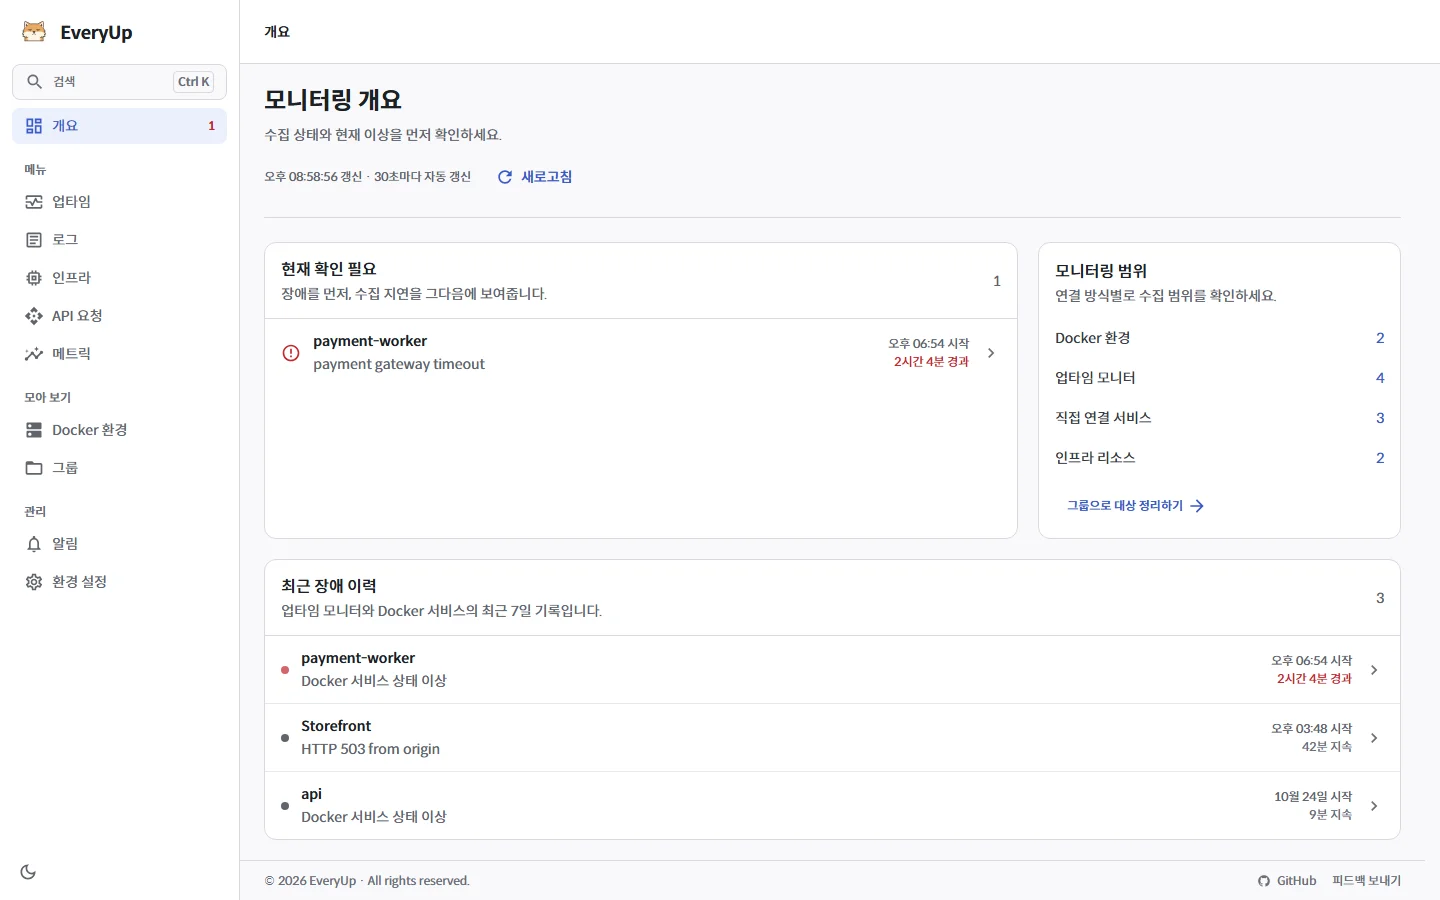
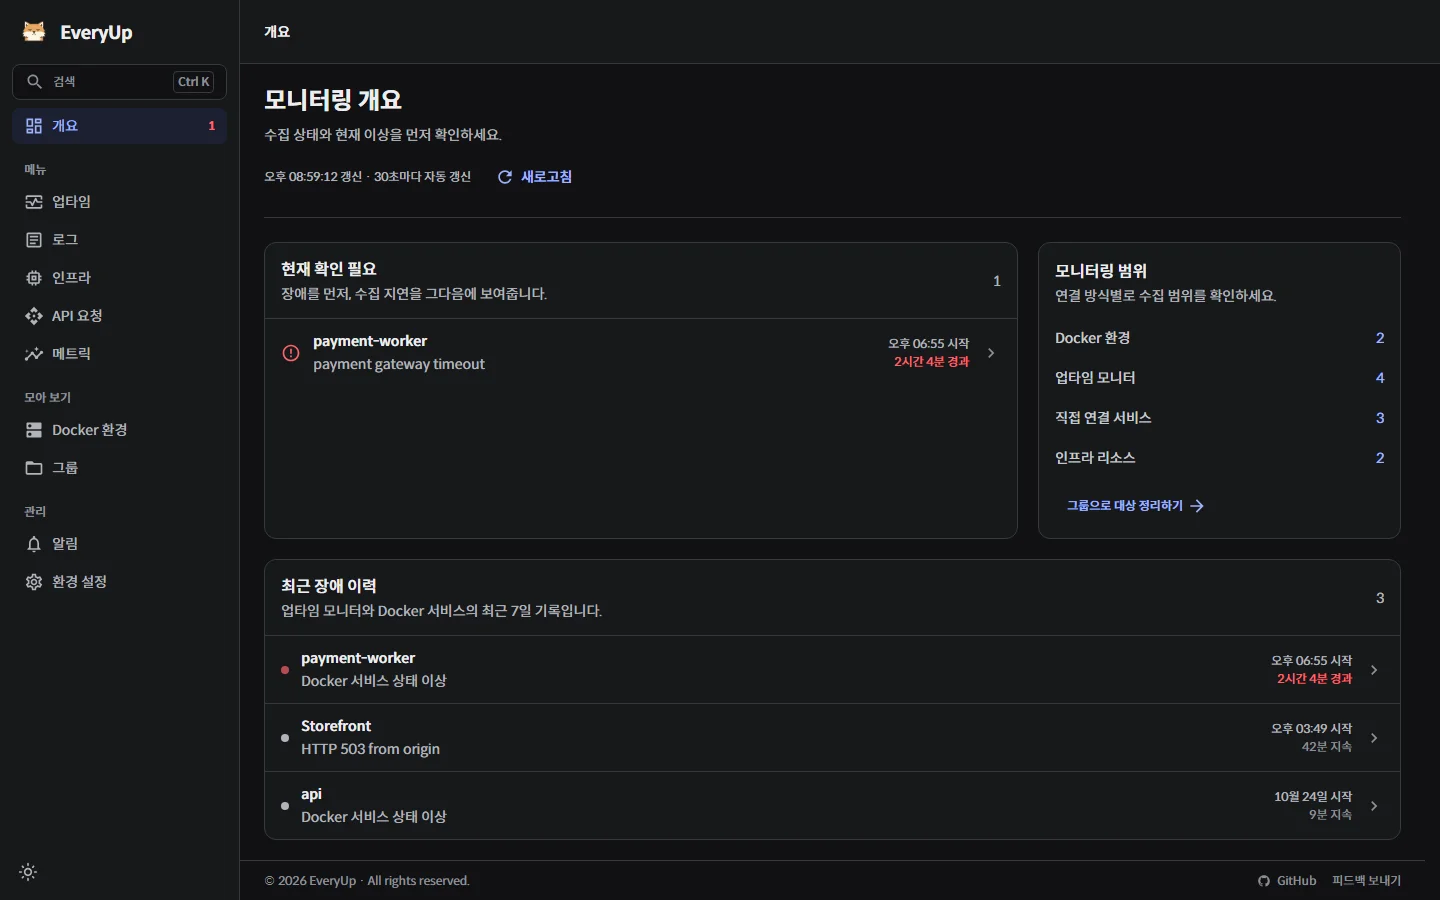
INFO
The dashboard interface is Korean only. These docs cover setup and configuration in English; the running UI looks like the screenshot above.
Features
The Uptime, Logs, Infrastructure, API requests, and Metrics pages show only the targets you configure directly. Response checks, container state, logs, host resources, and API requests collected by a Docker Collector appear in that Docker environment. Overview, groups, and alerts cover both paths.
| Feature | What you can inspect | Required setup |
|---|---|---|
| Overview | Failures, delayed collection, monitoring scope, recent incidents | Connect monitoring targets |
| Uptime | HTTP and TCP response checks from the uptime monitors you add | Add monitors |
| Infrastructure | Host CPU, memory, disk, and network trends | Connect a standard Collector or enable infrastructure collection in a Docker environment |
| Logs | Error and warning trends, recurring messages, search | Export OTLP logs directly or collect stdout/stderr in a Docker environment |
| API response times and traces | Request count, error rate, response time trends, spans | Connect the app directly through OpenTelemetry or the eBPF Observer in a Docker environment |
| Application metrics | Values and trends for metrics your app exports | Configure OTLP metric export in the app or Collector |
| Container state | Discovered containers, their running state and check results | Enable uptime collection in a Docker environment |
| API status | Request method, path, and status code parsed from access logs | App or proxy access-log output in a Docker environment |
| Header and body capture | Request details and captured bodies | Language-specific instrumentation. Automatic body capture is opt-in for Node.js |
| Notifications | Rules, channels, delivery results | Configure channels and enabled rules |
Compare API request trends with last week when historical data exists. Docker environments also show deployment and restart events. p95 latency means 95% of measured requests finished within that time. A span records one operation in a request's trace.
What Gets Collected
Direct connections
| Data | Source |
|---|---|
| HTTP and TCP check results and response times | Uptime monitor checks run by Web |
| App logs, traces, metrics | App OpenTelemetry SDK -> Web OTLP endpoint |
| Host CPU, memory, disk, network | Standard OpenTelemetry Collector |
Direct connections install no EveryUp component on the target server. Web connects to uptime monitor targets itself, so the dashboard server must be able to reach the target address.
Optional: Docker environment
A Docker environment is an optional integration: install the monitoring bundle on a Linux Docker server to collect per container without changing your apps. The Docker Collector follows your selected collection scope. The 기본 (Basic) profile collects container state and logs. 전체 (All) also enables host resources, API tracing, and OTLP metric reception.
Monitored server
docker.sock:roreads state & logsOTLP/HTTP :4318sends tracesHTTP(S) :3001no inbound ports
Dashboard server
Without the Collector
- Uptime monitorsResponse checks on public HTTP/TCP endpoints
- OTLP endpoint
/api/v1/otlpfor services outside Docker
HTTPSnotifications
- Telegram
- Discord
- Slack
Docker Collector
The following data is collected without app changes in the 전체 (All) profile. The installer mounts the Docker socket and /hostfs read-only only when the selected collection scope needs them.
| Data | Source |
|---|---|
| Container up/down, name, image, state | Docker socket |
| State-change and Collector events | Audit records generated by the Collector |
| stdout/stderr logs | docker logs |
| API request method, path, status (response times are not extracted) | Access-log parsing |
| Host CPU, memory, disk, network | /hostfs mount |
API status codes appear when the app or a proxy writes access logs to stdout/stderr. Without access logs, container state, regular logs, and host metrics are still collected.
Automatic eBPF Observer in the monitoring bundle
| Data | Source |
|---|---|
| API traces with real latency | everyup-ebpf eBPF Observer (OBI) |
| method, path, status, duration | Host process observation |
| Many languages including Go, and HTTPS services | OpenTelemetry eBPF Instrumentation |
See the eBPF guide for supported hosts, runtimes, and cross-service trace correlation requirements.
Optional: app-side OpenTelemetry instrumentation
| Data | Source |
|---|---|
| Request/response headers | http.*.header.* span attributes |
| Request/response bodies | *_body_masked span events |
| App metrics (JVM memory, GC, custom counters) | App OTel -> Web OTLP endpoint or Docker Collector :4318 |
OpenTelemetry (OTel) provides tools for collecting and exporting logs, traces, and metrics. These signals are sent using the OTLP protocol. Enabling metric reception does not generate app metrics. The bundle configures headers for Java and Node.js, with automatic body capture available as an opt-in for Node.js. Java body capture requires application code.
Next steps
Start Web and add your first uptime monitor with the Quick Start. The same page continues with connecting a Docker environment.